Quantcast
Channel: Duane Waddle
Viewing all 16 articles
Browse latest View live

Effect of kernel filesystem caching on Splunk performance

$
0
0

Unlike a traditional relational DBMS, Splunk does not use an in-process buffering or caching mechanism.  That is to say, there is not such thing as an SGA for your Oracle types, and the DB/2 DBAs may be disappointed to find there’s no bufferpool.  Instead, Splunk counts on the operating system’s native caching for files in order to cache data.

This can sometimes make it harder to know the effectiveness of memory in an indexer on search performance.  But, there are some very nice tools to help make some more information available.  One of these is a SystemTap script, https://sourceware.org/systemtap/wiki/WSCacheHitRate.  This gives us some visibility into the Linux kernel’s VFS layer to see how frequently the kernel is able to satisfy IOs from the cache versus having to issue IO against the actual block device.  I have made a 3 or 4 line change from the script on the SystemTap site in order to add a timestamp to each output line, but that’s all.

So let’s look at an example of a very dense search:

index=* splunk_server=splunkidx01.myplace.com | stats count

I’m running this from my search head, and limiting it to the single indexer in order to accurately measure, while it’s running, the overall cache effectiveness and CPU usage. I’ll manually finalize the search after approx 10,000,000 events. But before we start, let’s dump the kernel’s cache and confirm it’s been done.

[dwaddle@splunkidx01 ~]$ sudo -i bash -c "echo 1 > /proc/sys/vm/drop_caches"
[sudo] password for dwaddle: 
[dwaddle@splunkidx01 ~]$ free -g
             total       used       free     shared    buffers     cached
Mem:            94          2         91          0          0          0
-/+ buffers/cache:          2         92
Swap:            1          0          1
[dwaddle@splunkidx01 ~]$

Now we can run our search in one window, while running the SystemTap script in another and a top command in yet a third.  When the search has finished, we have (thanks Search Inspector!):

This search has completed and has returned 1 result by scanning 10,272,984 events in 116.506 seconds.
The following messages were returned by the search subsystem:

DEBUG: Disabling timeline and fields picker for reporting search due to adhoc_search_level=smart
DEBUG: [splunkidx01.myplace.com] search context: user="dwaddle", app="search", bs-pathname="/opt/splunk/var/run/searchpeers/searchhead.myplace.com-1397608437"
DEBUG: base lispy: [ AND index::* splunk_server::splunkidx01.myplace.com ]
DEBUG: search context: user="dwaddle", app="search", bs-pathname="/opt/splunk/etc"
INFO: Search finalized.

A little math says we were scanning about 88K events per second. Running the same search immediately after shows slightly improved performance in terms of events scanned per second.

This search has completed and has returned 1 result by scanning 10,194,402 events in 101.391 seconds.

The following messages were returned by the search subsystem:

DEBUG: Disabling timeline and fields picker for reporting search due to adhoc_search_level=smart
DEBUG: [splunkidx01.myplace.com] search context: user="dwaddle", app="search", bs-pathname="/opt/splunk/var/run/searchpeers/searchhead.myplace.com-1397608920"
DEBUG: base lispy: [ AND index::* splunk_server::splunkidx01.myplace.com ]
DEBUG: search context: user="dwaddle", app="search", bs-pathname="/opt/splunk/etc"
INFO: Search finalized.

Now, we’re up closer to 100K events scanned per second. So the cache helped, but not as much as you might expect considering the speed difference between memory and disk. If I look at the output of my two other data captures, we’ll see moderately higher CPU usage on the 2nd (cached) search:

First search:

21994 splunk    20   0  276m 115m 8260 S 90.4  0.1   1:33.54 [splunkd pid=2268] search 
21994 splunk    20   0  276m 115m 8260 R 89.5  0.1   1:36.24 [splunkd pid=2268] search 
21994 splunk    20   0  292m 121m 8260 R 82.6  0.1   1:38.73 [splunkd pid=2268] search 
21994 splunk    20   0  292m 120m 8260 S 92.1  0.1   1:41.51 [splunkd pid=2268] search

Second search:

 1087 splunk    20   0  280m 115m 8260 R 99.0  0.1   1:31.59 [splunkd pid=2268] search 
 1087 splunk    20   0  280m 118m 8260 R 100.1  0.1   1:34.62 [splunkd pid=2268] search 
 1087 splunk    20   0  288m 118m 8260 R 100.0  0.1   1:37.64 [splunkd pid=2268] search 
 1087 splunk    20   0  288m 117m 8260 R 100.0  0.1   1:40.66 [splunkd pid=2268] search

These are just samples, but you get the idea. In the first run, the search process had to wait longer for data to come off disk, thusly its (instantaneous) measure of CPU was lower. With the second, the faster I/O coming out of cache aggravated a CPU bottleneck.

Now if we look at the SystemTap cache hit data from the first run:

Timestamp                        Total Reads (KB)   Cache Reads (KB)    Disk Reads (KB)  Miss Rate   Hit Rate
Tue Apr 15 20:39:59 2014 EDT                10681               6665               4016     37.59%     62.40%
Tue Apr 15 20:40:04 2014 EDT                40341              19025              21316     52.83%     47.16%
Tue Apr 15 20:40:09 2014 EDT                12593               3033               9560     75.91%     24.08%
Tue Apr 15 20:40:14 2014 EDT                22348                  0              22416    100.00%      0.00%
Tue Apr 15 20:40:19 2014 EDT                47870              25754              22116     46.19%     53.80%
Tue Apr 15 20:40:24 2014 EDT                42429              19069              23360     55.05%     44.94%
Tue Apr 15 20:40:29 2014 EDT                38192              18080              20112     52.65%     47.34%
Tue Apr 15 20:40:34 2014 EDT                30952              15860              15092     48.75%     51.24%
Tue Apr 15 20:40:39 2014 EDT                29566              16098              13468     45.55%     54.44%
Tue Apr 15 20:40:44 2014 EDT                31857              16389              15468     48.55%     51.44%
Tue Apr 15 20:40:49 2014 EDT                38048              23796              14252     37.45%     62.54%
Tue Apr 15 20:40:54 2014 EDT                31849              18397              13452     42.23%     57.76%
Tue Apr 15 20:40:59 2014 EDT                39369              23689              15680     39.82%     60.17%
Tue Apr 15 20:41:04 2014 EDT                67282              49902              17380     25.83%     74.16%
Tue Apr 15 20:41:09 2014 EDT                45992              25052              20940     45.52%     54.47%
Tue Apr 15 20:41:14 2014 EDT                32761              17581              15180     46.33%     53.66%

And from the second run:

Timestamp                        Total Reads (KB)   Cache Reads (KB)    Disk Reads (KB)  Miss Rate   Hit Rate
Tue Apr 15 20:44:21 2014 EDT                46380              46380                  0      0.00%    100.00%
Tue Apr 15 20:44:26 2014 EDT                37688              37308                380      1.00%     98.99%
Tue Apr 15 20:44:31 2014 EDT                38865              38861                  4      0.01%     99.98%
Tue Apr 15 20:44:36 2014 EDT                35688              35656                 32      0.08%     99.91%
Tue Apr 15 20:44:41 2014 EDT                37148              36876                272      0.73%     99.26%
Tue Apr 15 20:44:46 2014 EDT                45258              36758               8500     18.78%     81.21%
Tue Apr 15 20:44:51 2014 EDT                44852              44424                428      0.95%     99.04%
Tue Apr 15 20:44:56 2014 EDT                43691              43123                568      1.30%     98.69%
Tue Apr 15 20:45:01 2014 EDT                31629              31357                272      0.85%     99.14%
Tue Apr 15 20:45:06 2014 EDT                87306              79490               7816      8.95%     91.04%
Tue Apr 15 20:45:11 2014 EDT                52173              51497                676      1.29%     98.70%
Tue Apr 15 20:45:16 2014 EDT                33108              32784                324      0.97%     99.02%
Tue Apr 15 20:45:21 2014 EDT                35159              34915                244      0.69%     99.30%
Tue Apr 15 20:45:26 2014 EDT                38391              37887                504      1.31%     98.68%
Tue Apr 15 20:45:31 2014 EDT                29253              29133                120      0.41%     99.58%

So in the end, what does this tell you?

  1. The kernel cache can help make Splunk searches faster up to the limit of a single core.  Because (as of current releases of Splunk) the search process is single-threaded, you can’t expect single searches to be sped up dramatically by RAM alone.
  2. You can use SystemTap to help tell you whether or not your indexer has “enough” RAM.  (A low cache hit rate = add a little more)  This will of course be most useful to those who are IO throughput-starved on their indexers.

Splunk – bucket lexicons and segmentation

$
0
0

About Segmentation

Event segmentation is an operation key to how Splunk processes your data as it is being both indexed and searched.  At index time, the segmentation configuration determines what rules Splunk uses to extract segments (or tokens) from the raw event and store them as entries in the lexicon.  Understanding the relationship between what’s in your lexicon, and how segmentation plays a part in it, can help you make your Splunk installation use less disk space, and possibly even run a little faster.

Peering into a tsidx file

Tsidx files are a central part of how Splunk stores your data in a fashion that makes it easily searchable.  Each bucket within an index has one or more tsidx files.  Every tsidx file has two main components – the values (?) list and the lexicon.  The values list is a list of pointers (seek locations) to every event within a bucket’s rawdata.  The lexicon is a list (tree?) containing of all of the segments found at index time and a “posting list” of which values list entries could be followed to find the rawdata of events containing that segment.

Splunk includes a not-very-well documented utility called walklex.  It should be in the list of Command line tools for use with Support, based on some comments in the docs page but it’s not there yet.  Keep an eye on that topic for more official details – I’ll bet they fix that soon.  There’s not a whole lot to walklex – you run it, feeding it a tsidx file name and a single term to search for – and it will dump the matching lexicon terms from the tsidx file, along with a count of the number of rawdata postings that contain this term.

Segmentation example

I have a sample event from a Cisco ASA, indexed into an entirely empty index.  Let’s look at how the event is segmented by Splunk’s default segmentation rules. Here is the raw event, followed up with the output of walklex for the bucket in question.

2014-05-10 00:00:05.700433 %ASA-6-302013: Built outbound TCP connection 9986454 for outside:101.123.123.111/443 (101.123.123.111/443) to vlan9:192.168.120.72/57625 (172.16.1.2/64974)
$ splunk cmd walklex 1399698005-1399698005-17952229929964206551.tsidx ""
my needle:
0 1  host::firewall.example.com
1 1  source::/home/dwaddle/tmp/splunk/cisco_asa/firewall.example.com.2014-05-10.log
2 1  sourcetype::cisco_asa
3 1 %asa-6-302013:
4 1 00
5 1 00:00:05.700433
6 1 05
7 1 1
8 1 10
9 1 101
10 1 101.123.123.111/443
11 1 111
12 1 120
13 1 123
14 1 16
15 1 168
16 1 172
17 1 172.16.1.2/64974
18 1 192
19 1 2
20 1 2014
21 1 2014-05-10
22 1 302013
23 1 443
24 1 57625
25 1 6
26 1 64974
27 1 700433
28 1 72
29 1 9986454
30 1 _indextime::1399829196
31 1 _subsecond::.700433
32 1 asa
33 1 built
34 1 connection
35 1 date_hour::0
36 1 date_mday::10
37 1 date_minute::0
38 1 date_month::may
39 1 date_second::5
40 1 date_wday::saturday
41 1 date_year::2014
42 1 date_zone::local
43 1 for
44 1 host::firewall.example.com
45 1 linecount::1
46 1 outbound
47 1 outside
48 1 outside:101.123.123.111/443
49 1 punct::--_::._%--:_______:.../_(.../)__:.../_(.../)
50 1 source::/home/dwaddle/tmp/splunk/cisco_asa/firewall.example.com.2014-05-10.log
51 1 sourcetype::cisco_asa
52 1 tcp
53 1 timeendpos::26
54 1 timestartpos::0
55 1 to
56 1 vlan9
57 1 vlan9:192.168.120.72/57625

Some things stick out immediately — all uppercase has been folded to lowercase, indexed fields (host,source,sourcetype,punct,linecount,etc) are of the form name::value, and some tokens like IP addresses are stored both in pieces and whole.  But let’s look at a larger example..

I’ve indexed a whole day’s worth of the above firewall log – 5,707,878 events.  The original file unindexed file is about 782MB, and the resulting Splunk bucket is 694MB.  Within the bucket, the rawdata is 156MB and the tsidx file is 538MB.

Cardinality and distribution within the tsidx lexicon

When we look at the lexicon for this tsidx file, we can see the cardinality (number of unique values) of the keywords in the lexicon is about 11.8 million.  The average lexicon keyword occurs in 26 events.

$ splunk cmd walklex 1399784399-1399698000-17952400407545127995.tsidx ""  | egrep -v "^my needle" | wc -l
11801764
$ splunk cmd walklex 1399784399-1399698000-17952400407545127995.tsidx ""  | 
      egrep -v "^my needle" | 
      awk ' BEGIN { X=0; }  { X=X+$2; } END { print X, NR, X/NR } '
309097860 11801764 26.1908

Almost 60% of the lexicon entries (7,047,286) have only a single occurrence within the lexicon — and of those, 5,707,878 are the textual versions of timestamps.

$ splunk cmd walklex 1399784399-1399698000-17952400407545127995.tsidx ""  | 
      egrep -v "^my needle" | 
      awk '$2==1 { print $0 }' | 
      grep -P "\d\d:\d\d:\d\d\.\d{6}" | 
      wc -l
5707878

Do we need to search on textual versions of timestamps?

Probably not.  Remember that within Splunk, the time (_time) is stored as a first-class dimension of the data.  Every event has a value for _time, and this value of _time is used in the search to decide which buckets will be interesting.  It would be infrequent (if ever) that you would search for the string “20:35:54.271819″.  Instead, you would set your search time range to “20:35:54″.  The textual representation of timestamps might be something you can trade-off for smaller tsidx files.

Configuring segmenters.conf to filter timestamps from being added to the lexicon

I created a $SPLUNK_HOME/etc/system/local/segmenters.conf as follows:

[ciscoasa]
INTERMEDIATE_MAJORS = false
FILTER= ^\d{4}-\d\d-\d\d \d\d:\d\d:\d\d.\d{6} (.*)$

Then I added to $SPLUNK_HOME/etc/system/local/props.conf a reference to this segmenter configuration:

[cisco_asa]
BREAK_ONLY_BEFORE_DATE=true
TIME_FORMAT=%Y-%m-%d %H:%M:%S.%6N
MAX_TIMESTAMP_LOOKAHEAD=26
SEGMENTATION = ciscoasa

Starting with a clean index, I indexed the same file over again.  Now, the same set of events requires 494MB of space in the bucket – 156MB of compress rawdata, and 339MB of tsidx files, saving me 200MB of tsidx space for the same data.  The lexicon now has 5,115,535 entries (down from 11,800,000) – and of those 1,332,323 are entries that occur only once in the raw data.  As I look at the items occurring once, a large fraction (1,095,570) are of the form 123.123.124.124/12345 – that is, an IPv4 address and a port number.  Some of the same IP addresses occur with many different values of port number – can we do anything to improve this?  Again, back to segmenters.conf:

[ciscoasa]
INTERMEDIATE_MAJORS = false
FILTER= ^\d{4}-\d\d-\d\d \d\d:\d\d:\d\d.\d{6} (.*)$
MAJOR = / [ ] < > ( ) { } | ! ; , ' " * \n \r \s \t & ? + %21 %26 %2526 %3B %7C %20 %2B %3D -- %2520 %5D %5B %3A %0A %2C %28 %29
MINOR = : = @ . - $ # % \\ _

This changes from the default so that “/” becomes a major segmenter.  Now, each IP address and port number will be stored in the lexicon as separate entries instead of there being an entry for each combination of IP and port.  My lexicon (for the same data) now has 2,767,084 entries – 23% of the original cardinality.  The average lexicon entry now occurs in 94 events.  My tsidx file size is down to 277MB – just a little over half of its original size.

Conclusions

What have I gained?  What have I lost?  I’ve lost the ability to search specifically for a textual timestamp.  I’ve gained a reduction in disk space used for the same data indexed.  I’ve slightly reduced the amount of work required to index this data.  I’ve made the job of splunk-optimize easier.

The improvement in disk space usage is significant and easily measured.  The other effects are probably not as easily measured.  Any data going into Splunk that exhibits high cardinality in the lexicon has a chance of making your tsidx files as large (if not larger) than the original data.  As Splunk admins, we don’t expect this because this is atypical for IT data.  By knowing how to measure (and possibly affect) the cardinality of the lexicon within your Splunk index buckets, you can be better equipped to deal with atypical data and the demands it places on your Splunk installation.


Splunk .conf 2014 slides and notes

$
0
0

This week I had the pleasure of speaking at Splunk .conf 2014.  George Starcher and I spoke on configuring Splunk’s various SSL options, with the goal of providing a cookbook with SSL configurations appropriate for moving from a POC/trial install into production.  Other that some audio problems (sorry!), I thought the session went very well.  As a rookie presenter, I owe George a great deal of thanks for both convincing me to submit this talk and for helping me to prepare and present.  If this talk was a success at all, it was entirely due to George.  Thanks, George!

Attached are the slides:

Splunk-SSL-Presentation (PDF)

There were several fantastic questions raised during the talk that I’d like to answer here before I forget them.

Why is SSL client authentication of forwarders worthwhile?

It really all depends on your environment.  Because we recommend that all forwarders share a common certificate (the throwaway certificate), client identification of a forwarder really comes down to the rough question of “is this a box I generally trust or not?”  A great example of where this might be valuable is a public cloud deployment.  We gave an example of a colleague who had to accept data from AWS instances where they struggled to predict what IP addresses those systems were coming from.  So he had to open his SSL data input to essentially anywhere, and used a client certificate as a simple way to keep entirely unassociated systems from forwarding data to his indexers.  In a purely private environment, you will probably have better tools to control who is allowed to submit data to your indexers.

Can I use tools other than OpenSSL to manage keys and certificates?

Splunk will use OpenSSL internally as its SSL library, not much can be done about that.  But if you have other tools you would prefer to use in order to generate and manage certificates,  everything will work fine as long as you export the keys and certificates into the PEM-encoded x.509 files that OpenSSL expects.  Some tools (GSKit was specifically mentioned in the question) can do exports to PKCS12 (PFX) files, which you can then bust open using the ‘openssl pkcs12‘ command (mentioned in the bonus slides).

What is the performance impact of doing SSL authentication?

It should be (nearly) negligible, but it depends a little on whether we are talking about something where Splunk has already enabled SSL by default (like the Splunkd REST port) versus something that is completely cleartext by default like data forwarding.  In the cases where SSL is enabled by default, the additional CPU cost of performing certificate verification and common-name checking are not incredibly high.  For data forwarding, there is certainly some additional CPU load introduced by turning on SSL.  The actual impact would be somewhat dependent on your environment.

What about wildcard certs?  Can I use those to simplify SSL configuration for my large and complex deployment?

There’s no reason you could not.  However, we have not tested how Splunk’s common name checking works with wildcard certificates.  Typically, wildcards are used where an application (like a browser) does common name checking based on the DNS name of the site.  In Splunk’s case, most of the SSL processing (browsers-to-Splunkweb being an obvious exception) uses common names statically set in configuration files.  I’m simply not sure how the common-name checking code in Splunk handles wildcards.  In a large, complex environment it may be acceptable to use a model of “certificate per role” where you have a single cert for “indexers”, another for “deployment server”, and another still for “forwarder”.  You lose a little individuality / ability to identify servers uniquely, but you simplify your configuration greatly.

Why use ECC crypto?

The principal advantage of Elliptic Curve Cryptography is that the same level of effective security can be attained using a much smaller key.  According to an NSA brief, an ECC key of 256 bits provides security comparable to an RSA key length of 3072 bits and needs less computing power to perform its cryptographic operations.  As we discussed in the talk, the main downside to ECC is the high cost in commercial certificates.  Eventually there will be more competition in the ECC certificate business and costs will come down.  Until then, commercial ECC certificates are cost prohibitive for many businesses.

Can you DS-deploy an app, with the password encrypted inside?

Splunk’s password encryption for SSL key files is based on the splunk.secret file.  Normally this file is randomly generated the first time a Splunk instance is started.  If you can distribute splunk.secret to a Splunk system prior to its first time starting, then all password encryption will be done using this distributed file.  Now you will be able to DS-deploy an app containing encrypted passwords and have them encrypted in storage in all places.  You can see more about this in the Splunk docs.

If there are any other questions, please bring those up in the comments.

Quick Hit – disabling SSLv3 in Splunk

$
0
0

Update 20141015 – Splunk’s official advisory has been released.

Update 20141016 – Changed from a specific TLS1.2 cipher to the generic “TLSv1.2″ suite.  Hat  tip to @techxicologist.

If you’ve not seen that SSLv3 is irreparably broken, go read about it, then grab a strong drink and come back.

Splunk (as of release 6.1) does not give you a lot of controls for enabling / disabling SSL protocols.  You have the supportSSLV3Only option in various config files (web.conf, server.conf, etc) but after the first sentence of this post you know you don’t want that set to “true”.  There isn’t a matching “supportTLSOnly” option, so you are somewhat limited in your mitigation choices.  For now, the best choice I see is using the cipherSuite option to force negotiation with only TLS 1.x ciphers.

Short story, drop this into your relevant .conf files:

supportSSLV3only=false
cipherSuite = TLSv1.2

By forcing Splunk to only use TLS 1.2 ciphers, we in effect disable SSLv3.  Unfortunately, we also disable TLS v1.0 and TLS v1.1.  This will severely limit your browser support for accessing Splunk.  If your browser is not the latest TLS v1.2-supporting new hotness, you’ll have no luck.

This same cipherSuite setting should work for Splunk-to-Splunk (data forwarding) and inter-Splunk (Deployment Server, Distributed Search, Clustering, etc) – as long as you are on Splunk 6.0 or later.  (I don’t think OpenSSL in Splunk 5.0 and below supported TLS 1.2 – if I’m wrong here let me know).  But please note there’s not been a lot of time for a lot of exhaustive testing here…

My analysis (and I’m no security professional so take with a grain of salt) is that your browser access to Splunkweb is the most at risk here because of things like the HTTP session cookies.  For other Splunk uses of SSL like Splunk-to-Splunk and inter-Splunk, the data streams are different and these are typically all inside the data center, making the necessary MITM much harder.

Keep a careful eye on the Splunk Blogs site and the Splunk Product Security Portal for any official news from Splunk themselves regarding this.  Hopefully they will have best practices, patches, or perhaps both in upcoming days.

Just to be entirely clear, this is not Splunk official advice.  I don’t work for Splunk, and neither of us speak for each other.  This may not work for you, but if it does (or does not!) let us know.


Splunking bash history

$
0
0

The history tools built into the bash shell are rather powerful and a great source of information about what has been done to a system.  One thing we can do to make these even more useful is add them as a data source in Splunk.  While imperfect (see caveats below), this can be helpful in demonstrating that your systems are well-monitored for activity performed by users.

If you were going to do this, you might consider something as simple as:

[monitor:///home]
whitelist=\.bash_history$
disabled=false

This is a good starting point, but it suffers from some issues:

  1. Recursively walking all of /home to find just a few small files can be expensive
  2. Users outside of /home are not seen
  3. The .bash_history file does not have timestamps, so you’ll get a _time equal to the index time

We can do better.  Bash gives us lots of options to change how its history works.  Let’s try this snippet in /usr/local/bin/bash-history.sh:

HISTBASEDIR=/var/log/bashhist

# are we an interactive shell?
if [ "$PS1" ] && [ -d $HISTBASEDIR ]; then

        REALNAME=`who am i | awk '{ print $1 }'`
        EFFNAME=`id -un`
        mkdir -m 700 $HISTBASEDIR/$EFFNAME >/dev/null 2>&1

        shopt -s histappend
        shopt -s lithist
        shopt -s cmdhist

        unset  HISTCONTROL && export HISTCONTROL
        unset  HISTIGNORE && export HISTIGNORE
        export HISTSIZE=10000
        export HISTTIMEFORMAT="%F %T "
        export HISTFILE=$HISTBASEDIR/$EFFNAME/history-$REALNAME

    case $TERM in
    xterm*)
            PROMPT_COMMAND='history -a && printf "\033]0;%s@%s:%s\007" "${USER}" "${HOSTNAME%%.*}" "${PWD/#$HOME/~}"'
                ;;
    screen)
            PROMPT_COMMAND='history -a && printf "\033]0;%s@%s:%s\033\\" "${USER}" "${HOSTNAME%%.*}" "${PWD/#$HOME/~}"'
        ;;
    *)
                        PROMPT_COMMAND='history -a'
        ;;
      esac
  # Turn on checkwinsize
  shopt -s checkwinsize
  PS1="[\u@\h \W]\\$ "
fi

This will configure bash to do several things:

  1. Store history files in /var/log/bashhist/<effective-username>/history-<actual-username>
  2. Add timestamps to history files
  3. Persist the history file to disk more frequently

The difference here between “effective” and “actual” plays a part when using su or  sudo to run a shell as another user.  When you enable these settings for root, and then do a sudo su -, the history file for root while you are su’ed will be stored in /var/log/bashhist/root/history-duane — or whatever your username is.

To fully enable this, we need to do a few more things.  First, we need to make the /var/log/bashhist directory with (hopefully) appropriate permissions. The top-level directory needs to be 777 permissions in order to allow the shell snippet to make directories for new users as needed. Like with /tmp, the sticky-bit should prevent wild deletion by other users.

sudo mkdir -m 1777 /var/log/bashhist

We need to enable users-of-interest to source this snippet of shell into their .profile scripts. Add to the necessary .profile scripts:

source /usr/local/bin/bash-history.sh

Then we need to configure Splunk to read the history files with the right settings for timestamps. In props.conf:

[bash_history]
TIME_PREFIX = ^#
TIME_FORMAT = %s
EXTRACT-userids = ^/var/log/bashhist/(?<effective_user>[^/]+)/history-(?<real_user>.*)$ in source

And in inputs.conf:

[monitor:///var/log/bashhist]
disabled=false
sourcetype=bash_history

If you’ve done all of this right, when you run the history command in bash you should see dates and times next to them, and bash histories should be searchable in Splunk.


Caveats

I mentioned caveats.  There are a few – and I’m probably leaving some out.

Shell history is not an accurate source of audit-quality proof of things that were done / not done on a system.  Nothing keeps a user from editing their history file after the fact.  Splunk does pick up changes to the history file quickly and forwards them off-host.  This may be a mitigating factor toward users editing the file to try to hide history, but a clever person would be able to evade.  It is a good way to help keep honest people honest, but it’s not a strong control against an attacker or a dishonest person.

Also, shell history is written after a command finishes.  If a user run a long-running command, like an ssh to a remote host, it won’t show up in the history until the task exits.

So, while it’s imperfect, this technique might be useful to you in keeping track of things happening on your Unix systems.  Suggestions and improvements welcome.

Nullqueue Sampling

$
0
0

One of the first things the average Splunk administrator has to learn about the hard way is how to send traffic to the Splunk nullQueue.  It’s almost a rite of passage — you configure a new data source, somewhat unaware of the tens of thousands of mostly-useless events it produces.  It blows out your license for a day or two, and then you then hit up answers, #splunk on IRC, or file a support case and quickly learn about how to use nullQueue.  With a few minutes of configuration, the mostly-useless events are filtered entirely, and you move on to the next challenge.

In some cases, this is not optimal.  Perhaps most of the tens of thousands of events are useless, but removing them entirely hides a solveable problem from your operations team.  How can we rate-limit certain messages in order to still see the event, but without using vast quantities of license volume to do so?  Until Splunk adds in proper support for rate-limiting of events, here is an approach you can take.

Suppose we have this message, occuring many thousands of times per day:

2014-03-03T23:29:00 INFO [Thread-11] java.lang.NullPointerException refreshing the flim-flam combobulator

We can’t directly tell Splunk “index a max of 1 of these per minute”, but can use a clever application of regular expressions to accomplish roughly the same.  Suppose we build our nullQueue as follows:

(props.conf)

[mysourcetype]
TRANSFORMS-null1 = sampledNull

(transforms.conf)
[sampledNull]
REGEX = ^\d{4}-\d{2}-\d{2}T\d{2}:\d{2}:(?!00).*java.lang.NullPointerException refreshing the flim-flam
DEST_KEY = queue
FORMAT = nullQueue

What we’ve done is used a negative assertion in PCRE to basically nullQueue any of these messages that do not occur in the :00 second of a minute. It’s not a perfect rate limit – but it should greatly reduce the quantity of indexed messages of this type without filtering them away entirely. We’re counting on a statistical property that these events occur all the time, somewhat evenly distributed, and “some” will be in the “:00″ second of a minute. In theory, this should sample these events at roughly 1/60th of their original throughput.

If you find this useful, or if you can think of a better way of accomplishing this please leave a comment.

Back from the brink?

$
0
0

I really gave up on blogging for a long time. “So busy” and all that. I’m trying to get back, lets just call all of that ‘excuses’. So in support of that, a whole bunch of housekeeping on the site.

  • Latest and greatest remote exploits .. err I mean wordpress 😉
  • SSL by default thanks to Let’s Encrypt
  • Hopefully Cisco Umbrella no longer calls the site malicious. Thanks for reminding me, xoff. I had my registrar, Namecheap, running a redirect page from http://duanewaddle.com to http://www.duanewaddle.com and their virtual hosting platform apparently hosts some filth from time to time. I guess Umbrella can’t block more granularly than an IP, so my whole domain was getting tied up in Namecheap’s ick.  That is hopefully fixed.  Let me know if it’s not.


Hopefully soon to come more posts, with actual content.

RHEL 7 UDP metrics into splunk metrics index

$
0
0

We were discussing this on splunk-usergroups slack, and I said I should post it here and vraptor and dawnrise urged me to do so quickly — so here I am.  (Thanks vraptor and dawnrise!)

First up, a script to use the nstat tool to grab some kernel UDP metrics and write them out in a format compatible with Splunk’s metrics store:

#!/bin/bash
FORMAT='"%s","%s","%s"\n'
typeset -A MAPPER
MAPPER=(
        [UdpInDatagrams]="udp.packets_received"
        [UdpInErrors]="udp.packet_receive_errors"
        [UdpRcvbufErrors]="udp.buffer_errors"
)
populate_metrics() {
  NOW=`date +%s`
  printf $FORMAT "metric_timestamp" "metric_name" "_value"
  while read METRIC VALUE JUNK; do
        printf $FORMAT "$NOW" "${MAPPER[$METRIC]}" "$VALUE"
  done <  <( nstat -z ${!MAPPER[@]} | egrep -v "^#" )
}
populate_metrics

The relevant inputs.conf:

[script://./bin/udp_metrics.sh]
index = my_metrics
sourcetype = metrics_csv
interval = 60

A search that uses it:

| mstats span=5m sum(_value) as value where index=my_metrics metric_name=udp.packets_received by host 
| xyseries _time host value

Obligatory picture:


Splunk pass4SymmKey for deployment client -> deployment server

$
0
0

Introduction

So you want to secure your Splunk deployment server?  There’s a couple of different angles to consider:

  1. Are all clients connecting to a given deployment server permitted to do so?
  2. Is the client certain that the deployment server they are talking to is the real one and not an impostor?

Let’s start at the docs, in the Securing Splunk Enterprise manual.  Here’s a screen cap from that page taken today (late July 2018):

I’ve highlighted the “Deployment server to deployment clients” part. That’s where we will focus our efforts today. The advice here is to use pass4SymmKey in order to secure Deployment Client to Deployment Server. As a reminder, pass4SymmKey is a symmetric secret shared between two Splunk nodes to authenticate system-to-system REST API usage.  The pass4SymmKey comes up frequently in conversations about License Masters, Cluster Masters, and Search Head Clustering.  But, in my experience, the use of pass4SymmKey related to Deployment Server is rare.  Let’s look into this a little deeper.

The Splunk server.conf file- has a pass4SymmKey option that can be set in a few different stanzas, so you can use a different value for different modes of communication.  At a minimum, there is one in the [general] stanza and one in the [clustering] stanza.  I’m going to steal a quote from the $SPLUNK_HOME/etc/system/README/server.conf.spec file.

pass4SymmKey = <password>
* Authenticates traffic between:
  * License master and its license slaves.
  * Members of a cluster; see Note 1 below.
  * Deployment server (DS) and its deployment clients (DCs); see Note 2
    below.
* Note 1: Clustering may override the passphrase specified here, in
  the [clustering] stanza.  A clustering searchhead connecting to multiple
  masters may further override in the [clustermaster:stanza1] stanza.
* Note 2: By default, DS-DCs passphrase auth is disabled.  To enable DS-DCs
  passphrase auth, you must *also* add the following line to the
  [broker:broker] stanza in restmap.conf:
     requireAuthentication = true
* In all scenarios, *every* node involved must set the same passphrase in
  the same stanza(s) (i.e. [general] and/or [clustering]); otherwise,
  respective communication (licensing and deployment in case of [general]
  stanza, clustering in case of [clustering] stanza) will not proceed.
* Unencrypted passwords must not begin with "$1$", as this is used by
  Splunk software to determine if the password is already encrypted.

There’s two quick caveats right out of the box.

First, the Deployment Client -> Deployment Server pass4SymmKey and the License Slave -> License Master pass4SymmKey are set using the same setting.  So, if you have a Deployment Server that is also a License Slave, then you’ll have to use the same pass4SymmKey all around.  This is probably not ideal.  Splunk Support will usually give you a “Deployment Server License” file.  It’s a 0 byte license that enables the Enterprise features.  This way,  your DS isn’t depending on your License Master and you can use different pass4SymmKeys for your DS/DC comms and your LM/LS comms.

Second, you have to explicitly enable the use of pass4SymmKey for Deployment Server.  That is what we will do today, and we will review the security properties achieved by this.

Enabling pass4SymmKey authentication at the DS

On our DS, we will create a $SPLUNK_HOME/etc/system/local/restmap.conf file with the stanza shown above, specifically:

[root@ds local]# cat <<EOF >> /opt/splunk/etc/system/local/restmap.conf
> [broker:broker]
> requireAuthentication = true
> EOF

Now, let’s use btool to make certain that my settings are as I expect them to be:

[root@6e6965b19f06 local]# /opt/splunk/bin/splunk btool --debug restmap list broker:broker
/opt/splunk/etc/system/local/restmap.conf [broker:broker]
/opt/splunk/etc/system/default/restmap.conf authKeyStanza = deployment
/opt/splunk/etc/system/default/restmap.conf match = /broker
/opt/splunk/etc/system/local/restmap.conf requireAuthentication = true

The requireAuthentication we added is there, but there’s something I didn’t expect.  See the authKeyStanza setting?  If we go digging a bit more in the spec file for server.conf.spec, we’ll find a mention of this:

[deployment]
pass4SymmKey = 
* Authenticates traffic between Deployment server (DS) and its deployment
clients (DCs).
* By default, DS-DCs passphrase auth is disabled. To enable DS-DCs
passphrase auth, you must *also* add the following line to the
[broker:broker] stanza in restmap.conf:
requireAuthentication = true
* If it is not set in the deployment stanza, the key will be looked in
the general stanza
* Unencrypted passwords must not begin with "$1$", as this is used by
Splunk software to determine if the password is already encrypted.

From the docs, this appears to have been added (to the spec files at least) around version 6.2.4, see SPL-99169.  But, it’s not been (to my knowledge) very well advertised.  Maybe this post and the docs feedback I’m submitting will help publicize it a little more.  But, given this new knowledge, we should be able to use a different pass4SymmKey for DC/DS as we do for license master connectivity — assuming we have a “reasonably modern” Splunk on both ends.  So let’s set up our DS to expect a pass4SymmKey, and our UF to use the same one to talk to it.

[root@ds local]# cat <<EOF >> /opt/splunk/etc/system/local/server.conf
> [deployment]
> pass4SymmKey = myReallyAwesomeSecret123
> EOF


Enabling pass4SymmKey at the UF

[root@uf local]# cat <<EOF >> /opt/splunkforwarder/etc/system/local/server.conf
> [deployment]
> pass4SymmKey = myReallyAwesomeSecret123
> EOF
[root@uf local]# cat <<EOF >> /opt/splunkforwarder/etc/system/local/deploymentclient.conf
> [target-broker:deploymentServer]
> targetUri = 172.17.0.2:8089 
> EOF

We then restart both, and can see the UF successfully calling home to the Deployment Server.

09-03-2018 23:34:20.509 +0000 INFO HttpPubSubConnection - SSL connection with id: connection_172.17.0.3_8089_172.17.0.3_ec9863789248_64A3C887-9546-45E5-B2DD-12A3395C07CE
09-03-2018 23:34:20.514 +0000 INFO HttpPubSubConnection - Running phone uri=/services/broker/phonehome/connection_172.17.0.3_8089_172.17.0.3_ec9863789248_64A3C887-9546-45E5-B2DD-12A3395C07CE
09-03-2018 23:34:21.376 +0000 INFO HttpPubSubConnection - Running phone uri=/services/broker/phonehome/connection_172.17.0.3_8089_172.17.0.3_ec9863789248_64A3C887-9546-45E5-B2DD-12A3395C07CE
09-03-2018 23:34:21.378 +0000 INFO DC:HandshakeReplyHandler - Handshake done.

Wrong Password

Now, let’s change the pass4SymmKey at the UF to see what happens to a UF that has the wrong pass4SymmKey.  So I open my server.conf in my editor on the UF, change the pass4SymmKey line under [deployment] to:

pass4SymmKey = anotherAwesomeSecret456

followed by another quick restart.  We see pretty quickly looking at the UF’s own logs that the client is continuously erroring out on its attempt to phone home, but the only evidence of a problem at the Deployment Server is HTTP status 401’s in splunkd_access.log, like so:

172.17.0.3 - - [04/Sep/2018:00:10:07.860 +0000] "POST /services/broker/connect/64A3C887-9546-45E5-B2DD-12A3395C07CE/ec9863789248/a0c72a66db66/linux-x86_64/8089/7.1.2/64A3C887-9546-45E5-B2DD-12A3395C07CE/universal_forwarder/ec9863789248 HTTP/1.1" 401 148 - - - 0ms
172.17.0.3 - - [04/Sep/2018:00:11:03.778 +0000] "POST /services/broker/connect/64A3C887-9546-45E5-B2DD-12A3395C07CE/ec9863789248/a0c72a66db66/linux-x86_64/8089/7.1.2/64A3C887-9546-45E5-B2DD-12A3395C07CE/universal_forwarder/ec9863789248 HTTP/1.1" 401 148 - - - 0ms
172.17.0.3 - - [04/Sep/2018:00:11:37.783 +0000] "POST /services/broker/connect/64A3C887-9546-45E5-B2DD-12A3395C07CE/ec9863789248/a0c72a66db66/linux-x86_64/8089/7.1.2/64A3C887-9546-45E5-B2DD-12A3395C07CE/universal_forwarder/ec9863789248 HTTP/1.1" 401 148 - - - 0ms
172.17.0.3 - - [04/Sep/2018:00:12:45.953 +0000] "POST /services/broker/connect/64A3C887-9546-45E5-B2DD-12A3395C07CE/ec9863789248/a0c72a66db66/linux-x86_64/8089/7.1.2/64A3C887-9546-45E5-B2DD-12A3395C07CE/universal_forwarder/ec9863789248 HTTP/1.1" 401 148 - - - 0ms
172.17.0.3 - - [04/Sep/2018:00:13:59.000 +0000] "POST /services/broker/connect/64A3C887-9546-45E5-B2DD-12A3395C07CE/ec9863789248/a0c72a66db66/linux-x86_64/8089/7.1.2/64A3C887-9546-45E5-B2DD-12A3395C07CE/universal_forwarder/ec9863789248 HTTP/1.1" 401 148 - - - 0ms


Can a fake DS still work?

So we’ve been relatively successful at satisfying our first requirement – we can ensure that only authorized UFs are allowed to connect to our DS and download apps from it.  The key management does not work great at scale, as everyone must use the same pass4SymmKey.  But, the basic requirement is met.  What about our second requirement?  Can we be certain, though, that the client is talking to an authorized DS?  Let’s make our DS no longer require client authentication by disabling restmap.conf:

[root@ds splunk]# cd /opt/splunk/etc/system/local/
[root@ds local]# mv restmap.conf restmap.conf.save
[root@ds local]# vi server.conf
   #  Remove the [deployment] stanza entirely from server.conf
[root@ds local]# /opt/splunk/bin/splunk restart

After disabling the DS-side authentication requirement, the UF is able to connect to the DS immediately — even though it is sending a pass4SymmKey that does not match the DS.  Because the DS is no longer demanding a pass4SymmKey, what the client sends does not matter.  So, this proves more-or-less that pass4SymmKey is helpful for one of our requirements, but not the other.

Conclusion

We’ve shown that pass4SymmKey does an adequate job of only allowing authenticated UFs to connect to a DS, but it does not provide strong enough authentication properties to prevent a client from connecting to a fake DS.  An attacker could, through several different techniques, trick your UFs into connecting to an attacker-controlled Deployment Server.  The Deployment Server can cause execution of arbitrary code on any Deployment Client connected to it, as the user running Splunk on the Deployment Client.  Your Deployment Server should be as robustly protected and monitored as your Puppet, Chef, SCCM, or other configuration management services.

If you want to protect your clients from connecting to a fake DS, then you will have to take the route of correctly configuring TLS on the Deployment Server to use a genuine CA-issued certificate (internal or external CA), and enable the deployment clients with the proper root chain, as well as enabling sslVerifyServerCert and commonNameToCheck.

Based on this testing, I’m going to go back to the excellent Splunk Docs team and suggest some edits to this section of the docs to make clear the difference in these two properties and how to best achieve each.  Look for updates here and there.


Splunk 7.2.2 and systemd

$
0
0

Consider this a draft.  I’ll update it as I have time, but I’m posting now because it may help someone.

Splunk 7.2.2 brought along new features (which previously didn’t happen in a “maintenance release” – but that’s another topic for another time).  One of the new features is “systemd support”.  It didn’t take long before folks were on Splunk Answers wondering where their cheese had been moved to.  Some workarounds were provided, some of which work in some cases but not others.   So, @automine and I dug into a little more late today.  (Not done yet though)

When Splunk 7.2.2 is installed on a systemd-compatible system and you use splunk enable boot-start to create the systemd unit file, the Splunk CLI changes its mode of operation for the start, stop, and restart commands.   Specifically, it passes them through as calls to systemctl.  Below is a snippet of an strace capture of me running splunk stop as the splunk user.

29384 mmap(NULL, 4096, PROT_READ|PROT_WRITE, MAP_PRIVATE|MAP_ANONYMOUS, -1, 0) = 0x7fc4f84fb000
29384 write(1, "Stopping splunkd...\n", 20) = 20
29384 write(1, "Shutting down.  Please wait, as "..., 61) = 61
29384 clone(child_stack=0, flags=CLONE_CHILD_CLEARTID|CLONE_CHILD_SETTID|SIGCHLD, child_tidptr=0x7fc4f84f2a10) = 29417
29384 wait4(29417,  <unfinished ...>
29417 set_robust_list(0x7fc4f84f2a20, 24) = 0
29417 execve("/opt/splunk/bin/systemctl", ["systemctl", "stop", "Splunkd"], [/* 30 vars */]) = -1 ENOENT (No such file or directory)
29417 execve("/usr/local/bin/systemctl", ["systemctl", "stop", "Splunkd"], [/* 30 vars */]) = -1 ENOENT (No such file or directory)
29417 execve("/bin/systemctl", ["systemctl", "stop", "Splunkd"], [/* 30 vars */]) = 0
29417 brk(NULL)                         = 0x55c9c4485000


We see it fork a new child, and exec “systemctl stop Splunkd“.  Notice no call to sudo or anything here.  In a lot of customer environments I see/work in, the “Splunk Team” and the “OS team” exist on other sides of an organizational wall.  In Splunk 7.2.1, you could have easily use the splunk user as a service account and issue stop/start/restart commands to your heart’s content and it mostly just works.  In 7.2.2, those commands no longer work for you because Splunk MUST ask systemd to handle the stops and starts for it, so that systemd knows what is happening and can do process restarts and so forth.

One reasonable workaround here is adding sudo rules, and retraining the Splunk Team to use them.  Some sudo rules like these (courtesy of automine) make it possible for the splunk service account to issue the needful commands to systemd in order to stop/start/restart splunk:

splunk ALL=(root) NOPASSWD: /usr/bin/systemctl restart Splunkd.service
splunk ALL=(root) NOPASSWD: /usr/bin/systemctl stop Splunkd.service
splunk ALL=(root) NOPASSWD: /usr/bin/systemctl start Splunkd.service 
splunk ALL=(root) NOPASSWD: /usr/bin/systemctl status Splunkd.service

These don’t help without retraining though!  If your Splunk Admins continue to try to use the classic bin/splunk restart command that worked before, they will continue to be asked to authenticate as a wheel user each time.

Another workaround provided on Splunk Answers by twinspop adds rules to polkit to have systemd allow for the splunk user to make these calls without issue.  In this way, the classic bin/splunk restart would be transparently proxied to systemctl restart Splunkd, and systemctl would say “oh cool I don’t have to authenticate for this” and it would just happen.  Sadly, this workaround does not work on RHEL or Centos (tested at 7.6) because the version of systemd is too old there to provide the context that the policy needs.  Neither does it work on Ubuntu 18.04 because the version of Polkit on 18.04 is (best I can tell) too old to support Javascript polkit rules.

This workaround may work amazingly on other distributions, I’ve not tried them all yet.


Things you can do

  1. Use the sudo rules and retrain yourself to always use systemctl to manage your splunk processes
  2. Harass Splunk to add a capability to have their behind-the-scenes calls to systemd be prefaced w/ sudo
  3. Harass RHEL to backport the needful systemd chunks to their version of systemd.
  4. Harass Ubuntu to adopt a more modern polkit
  5. Use some other Linux distribution
  6. Stay on the Splunk 7.1 release train for the foreseeable future

I would not advise getting to 7.2.0 or 7.2.1 and “parking” there.  Any future 7.2 maintenance release is going to have this in it (unless Splunk takes it out further down the road and I hope they don’t).


Splunk and POSIX capabilities

$
0
0

I seem to catch myself talking about this a lot in Slack, so I’m just going to write it all down here and refer people to it.

A common issue for Splunk deployments is how to securely deploy the Universal Forwarder.  Best practice says “don’t run anything as root that doesn’t need to”, but there’s a counter argument:  maintaining filesystem permissions for an unprivileged process to read “all the log files” on a given system is hard.

The Unix permissions model gets a little hairy here – you wind up either making the splunk user a member of a bunch of different groups and enforcing that all of the log files have the group-read bit  (oh and all of the directories down from the root have either g+rx or o+rx), or you dive into the abyss of setfacl for each file that you want Splunk to read.  One challenge here is that maintaining permissions like these across disparate apps is often highly customized to a single server or a small group of servers running the same workload.  The apps change, the way the app handled log rotation changes, by some manner eventually permissions change.  You have to stay on top of it.

Consider the case where we are collecting logs for security monitoring. In this use case, messed up permissions equals a loss of visibility.  You don’t want to lose visibility, but you also don’t want to run as root.  So you’re left with honestly two poor choices.  Either you:

  • Run as root, be guaranteed you’ll always be able to read all the logs and won’t ever have a loss of visibility for your security monitoring.  You accept that a compromise of splunkd gives the attacker root access.

Or

  • Run splunk as an unprivileged user and configure filesystem access to allow this unprivileged user to see the files it needs to see.  You accept that any permissions errors result in a loss of visibility that could give an attacker the ability to exist in your environment undetected.


I tried to find a third way.  Unfortunately, it doesn’t work.  If you were looking for a great solution to this, I’ve let you read this far only to let you down.  Sorry.  Unless you’re on Solaris, but I’ll get to that in a minute!

The third way I tried to make work was POSIX capabilities.  The idea of capabilities being “let’s take all of the things that make root, well… root, and export them as granular items.”  For example, “only root can make a process listen on a port < 1024” — becomes CAP_NET_BIND_SERVICE.  Only a process with CAP_NET_BIND_SERVICE can listen on a port < 1024.  Or, “only root can kill a process owned by another user” becomes CAP_KILL.  Only a process with CAP_KILL can send signals to a process owned by any user.  In Linux, capabilities are assigned to a binary on disk.  So, you could setcap CAP_NET_BIND_SERVICE /usr/local/bin/myprogram and any instantiations of myprogram by any user should be able to listen on a port < 1024.

The capability that a Splunk UF really needs is called CAP_DAC_READ_SEARCH.  A program granted CAP_DAC_READ_SEARCH can read any file on disk without permissions checks, just like root.  It cannot change them, but it can read them.  It’s like a capability purpose-built for a log collection agent.

I did some testing of this in both Solaris and Linux.   Good news for Solaris people – if you launch Splunk using an SMF manifest then SMF can pass CAP_DAC_READ_SEARCH onward to splunkd, and it works great.

For Linux folks, the news is not as good.  There’s a couple of open issues with Splunk, SPL-115155 and SPL-112588.  These two highlight a couple of known issues with making Splunk work properly with CAP_DAC_READ_SEARCH.   If you have a support contract, and would like to be able to run Splunk as a non-root user and use CAP_DAC_READ_SEARCH to enable it to successfully read log files without you having to set and maintain granular permissions then you should open a case asking for it.


There!  Now I can just link people here when this comes up.  Thanks for reading.

Proving a Negative

$
0
0

I’ve got this Foo Fighters lyric stuck in my head …

All my life I’ve been searching for something.  Something never comes, never leads to nothing.

This seems, relevant, given my focus on search technologies in my career.  Today, I’m going to talk about proving a negative.  That is, I’m going to talk about searching for something that does not exist.  This is a problem that seems to come up all the time – how do I find the thing that didn’t happen?  Usually in the Splunk Usergroups Slack, or in Splunk Answers it’s disguised as things like “find my missing <X>”, where <X> is “host”, “server”, “application”, or something.

George and I talked about this a long long time ago at a Splunk conference in the context of a lookup talk.  At the time we called it a “sentinel lookup”, but the term really didn’t catch on anywhere.  I’m going to revisit that approach, and maybe improve on it a little.

Last night, I set up a new install of Splunk Enterprise 8.0.0.0, along with Clint’s excellent gogen tool.  I used an out-of the-box gogen configuration to send in logs from my 5 example webservers.  I can see this using the search:

earliest=-1d index=main sourcetype=access_combined | stats count by host

Oh dear .. one of my webservers is missing.  I can see this, just looking at it – but what if I had 5,000 webservers?  Scrolling through that list to eyeball the missing one would take some effort.

Why don’t I have a line for web-04.bar.com with a count of zero?

Because Splunk’s search facility CANNOT USE SEARCH TO FIND WHAT DOES NOT EXIST.  This is important.  There are no events for web-04.bar.com, so it’s not possible to use search to find them.  We need an enumeration of all possible webservers in order to help identify the ones that did not come out in our search results.

What is the best way of making an enumeration?  I believe it’s a lookup.  So let’s make a lookup file, in /opt/splunk/etc/apps/search/lookups/webservers.csv:

host
web-01.bar.com
web-02.bar.com
web-03.bar.com
web-04.bar.com
web-05.bar.com

Yes it’s a CSV with exactly one column.  I could have made it more complex but I didn’t.  We can test it with the inputlookup search command like so:

| inputlookup webservers.csv

There we go – all 5 are listed in my lookup.  Now let’s marry these two objects together in a search.

earliest=-1d index=main sourcetype=access_combined 
| stats count by host 
| inputlookup append=true webservers.csv 
| fillnull count 
| stats sum(count) as count by host

Hey, now I have a line for web-04.bar.com with a count of zero.  I can alert on that!  I threw this together without a lot of explanation, so let’s talk through it in pieces…

earliest=-1d index=main sourcetype=access_combined 
| stats count by host

This part you know all about.  We’re finding the events that do exist in the search results.

| inputlookup append=true webservers.csv
| fillnull count

Now we’re appending the contents of our enumeration lookup, using a fillnull to fill in the count column if it happens to be null.  Now, every host in the lookup will exist at least once, with a zero count.  And some hosts – the ones where we have data in the search results – will have a second row with a count of their actual events seen in the data.

| stats sum(count) as count by host

Here we are taking a little advantage of basic elementary school math.  Anything plus zero is itself.  So we do a second stats to sum up the counts by host.  Now, we are left with only one row per value of host – it will either be the original count from the search results (for a host that was in the original search results), or it will be zero (for a host that was not).

So it turns out it really is easy to search for something that doesn’t exist – you just have to know all of the possible values of what could or could not exist…

How do I make my lookup of all possible hosts, though?  Well, the easiest way of doing that is “know your environment”.  There is a reason why “Inventory of hardware assets” is CIS Control #1.

Until next time..

Searching date-time values in Splunk

$
0
0

If you’ve worked with Splunk for a little while then you are probably familiar with the existence of the field _time.  With Splunk being a time series data store, it makes sense that every event will have a time.  Internally, Splunk parses the timestamp from your event and converts it to epoch (seconds since Jan 1 1970 00:00:00 UTC).  When you use your time range picker to select a time range, that is also converted internally to epoch and used to control what data is searched.

Sometimes, though, you may have events with multiple timestamps.  While this is less common in your typical infosec dataset, it can happen in other types of data.  For argument’s sake, let’s suppose we have an event with two timestamps in it.  One is the main _time of the event, and the other is some other related timestamp.  What we want to do is be able to filter on BOTH of these timestamps efficiently.

Coming from a RDBMS world, this other timestamp might be defined as a DATETIME data type (MySQL, DB2), a TIMESTAMP (Oracle, PostgreSQL), or other similar data type.  Defined in this way, you can build indexes including that column and efficiently filter based upon it.  Splunk does not work in this way.  To begin with, Splunk doesn’t even have the concept of “columns”.  Also, all of the data in your event is stored as text in a field called _raw.  We can enable indexed extractions to have Splunk create indexed fields of all your of data at index time, but even then there is no concept of data type.  This means that your secondary timestamp is stored as a text string, which makes filtering on it incredibly difficult.

Here’s our example data.  It’s lame I know, bear with me.

date,time,seqno,datefield
2020-06-27,21:48:00,1,1995-12-31 18:35:35
2020-06-27,21:49:00,2,2005-01-01 12:00:00

In this super simple / lame CSV, we have two timestamps.  For argument’s sake, let’s say this is HR data with the “date“, “time” fields representing the hire event and “datefield” is the person’s birthdate.  (Sorry I’m a horrible example-maker).  We have configured INDEXED_EXTRACTIONS per the below to create indexed fields of each column of this CSV.

[epoch_example]
INDEXED_EXTRACTIONS=csv
TIMESTAMP_FIELDS=date,time

Cool.  Now, we want to search for employees born before year 2000.

index="epoch_example" datefield=199*

Looking at this in the job inspector, we see the LISPY generated is relatively efficient.  Because we used a wildcard, it is able to scan for text strings matching 199* and use that as filter criteria.

base lispy: [ AND 199* index::epoch_example ]

But, this is absolutely treating the datefield as nothing more than a text string.  If we wanted to do more elaborate filtering on it we might try something like this:

index="epoch_example" datefield < "2003-02-04 13:11:11"

We get results back fast … because there’s only two events to look at.  Let’s compare the lispy to the one above.

base lispy: [ AND index::epoch_example ]

Oops.  We’re now scanning EVERYTHING in the index at the lispy stage, and then having to post-filter once events are brought back from raw on disk.  It works but it’s incredibly inefficient.  As I said above, Splunk does not store datefield in any particular data type except text string.  And its inverted index scheme does not know how to do range comparisons on text strings.  This is unfortunate, and a whole lot of build up to a neat trick I’d like to share.

Splunk can do range comparisons of indexed fields when those indexed fields are integers.  Let’s demonstrate.  I’m going to add a new thing to my props.conf to make an index time transformation.

[epoch_example]
INDEXED_EXTRACTIONS=csv
TIMESTAMP_FIELDS=date,time
TRANSFORMS-evals = epoch_example_datefield_epoch

And in my transforms.conf I’m going to use a neat new thing called INGEST_EVAL to create a new indexed field at index time.  Yes this means I have to re-index this data.  Nothing’s perfect, sorry.

[epoch_example_datefield_epoch]
INGEST_EVAL = datefield_epoch=strptime(datefield,"%Y-%m-%d %T")

So now – at index time – Splunk will store my datefield twice.  It stores it once as its normal string value, and once in another field called datefield_epoch that is storing an epoch value.  We can now use a fields.conf to tell Splunk that datefield_epoch is an indexed field, and do range queries based on it.

[datefield_epoch]
INDEXED=true

Now let’s run a search and compare the lispy we get:

index="epoch_example" datefield_epoch < 123456789

And its lispy:

base lispy: [ AND index::epoch_example [ LT datefield_epoch 1234567890 ] ]

Ooh look at that.  A range search on the epoch field.  Now we’re cookin’ with gas.  The only truly unfortunate thing about this is that now my user has to know to convert times to epoch before putting them into the search string.  Maybe there’s an easy way around that with a macro.  I originally had a really ugly macro, but the ever-helpful Martin Müller showed me a much more elegant way using an eval-based macro:

[epoch(1)]
args = arg1
definition = printf("%d",round(strptime("$arg1$", "%Y-%m-%d %T")))
iseval = 1

Now I can use this macro to make my search easier:

index="epoch_example" datefield_epoch < `epoch("2009-02-13 17:31:30")`

And my resultant lispy still has the range comparison in it:

base lispy: [ AND index::epoch_example [ LT datefield_epoch 1234567890 ] ]

I’m pretty pleased with this.  If you want to play with / use this on your own, I’ve put all the configs above in a splunk app on GitHub at https://github.com/duckfez/splunk-epoch-example.  Enjoy, and be sure to smash those like and subscribe buttons.

New Host, lost some comments

$
0
0

I moved the blog to a new host. The old one was getting pretty old. In the process I got rid of Disqus and went to native WP comments, and cannot get the comment sync to work properly. So I’ve lost some comments, sorry. I don’t think this really affects anyone but me.

Splunk UF 9.0 and POSIX Capabilities

$
0
0

Sorry this has taken so long to post. I caught a (thankfully very mild) case of covid at .cough2022 and between then and now life has not found a way (sorry Jurassic Park). Hopefully this is just the first of a few posts on stuff I’ve been working on and learning about since then.

Anyone who reads this very infrequently updated blog might have seen the over 3 year old post now, https://www.duanewaddle.com/splunk-and-posix-capabilities/. This was mostly a rant about what didn’t work, why it didn’t work, and the operational issues that it brought for Splunk administrators trying to run a “best practices” system where different best practices were in conflict:

  • Don’t run daemons as root
  • Do try to collect all of the logs from your systems
  • Don’t make sensitive log files world readable

Finally we have some good news resolving this. Splunk 9.0 includes running the Universal Forwarder in a “least privileged” mode. The docs say much more about this in detail, but the short version is that Splunk made the UF able to use POSIX capabilities in a way that enables admins to run Splunk “as splunk” (not as root), but still be able to read (and only read) all of the files on the system. On new installations this is the default (yay!)

Here’s one of my personal machines:


 [root@stinky local]# ps -fu splunk
UID          PID    PPID  C STIME TTY          TIME CMD
splunk     43027       1  0 16:28 ?        00:00:04 splunkd --under-systemd --systemd-delegate=yes -p 8089 _internal_launch_under_systemd
splunk     43052   43027  0 16:28 ?        00:00:00 [splunkd pid=43027] splunkd --under-systemd --systemd-delegate=yes -p 8089 _internal_launch_under_systemd [process-runner]

[root@stinky local]# lsof -p 43027 | egrep /var/log/audit
splunkd 43027 splunk   89r      REG              252,1  7014280  12924618 /var/log/audit/audit.log

[root@stinky local]# ls -l /var/log/audit/audit.log 
-rw-------. 1 root root 7024453 Nov 12 16:50 /var/log/audit/audit.log

Observe Splunk is running as user splunk, but it has a file open (/var/log/audit/audit.log) that is only readable by root. Witchcraft? Nah, CAP_DAC_READ_SEARCH. We can see that the systemd unit file for SplunkForwarder enables CAP_DAC_READ_SEARCH as an AmbientCapability, so that when the process starts it is blessed with this ability.

[root@stinky local]# systemctl cat SplunkForwarder
# /etc/systemd/system/SplunkForwarder.service
#This unit file replaces the traditional start-up script for systemd
#configurations, and is used when enabling boot-start for Splunk on
#systemd-based Linux distributions.

[Unit]
Description=Systemd service file for Splunk, generated by 'splunk enable boot-start'
After=network-online.target
Wants=network-online.target

[Service]
Type=simple
Restart=always
ExecStart=/opt/splunkforwarder/bin/splunk _internal_launch_under_systemd
KillMode=mixed
KillSignal=SIGINT
TimeoutStopSec=360
LimitNOFILE=65536
LimitRTPRIO=99
SuccessExitStatus=51 52
RestartPreventExitStatus=51
RestartForceExitStatus=52
User=splunk
Group=splunk
NoNewPrivileges=yes
AmbientCapabilities=CAP_DAC_READ_SEARCH
ExecStartPre=-/bin/bash -c "chown -R splunk:splunk /opt/splunkforwarder"
Delegate=true
CPUShares=1024
MemoryLimit=1861214208
PermissionsStartOnly=true
ExecStartPost=/bin/bash -c "chown -R splunk:splunk /sys/fs/cgroup/system.slice/%n"

[Install]
WantedBy=multi-user.target

CAP_DAC_READ_SEARCH means that Discretionary Access Control (the normal Linux filesystem permissions model) is bypassed for “read” and “search” operations. From the Linux man pages:

CAP_DAC_OVERRIDE
      Bypass file read, write, and execute permission checks.  (DAC is an abbreviation of "discretionary access control".)

CAP_DAC_READ_SEARCH
      * Bypass file read permission checks and directory read and execute permission checks;
      * invoke open_by_handle_at(2);
      * use the linkat(2) AT_EMPTY_PATH flag to create a link to a file referred to by a file descriptor.

So the UF can read any file – including sensitive ones like /etc/shadow. But, it has no other “root” characteristics or abilities. Its (or its children) cannot change system configuration. While I’ve not tried it yet, I feel like you should be able to use the standard linux audit system to keep an eye on any files the UF should not be accessing.

Since I’m making Jurassic Park references today…

there it is

An evening with SVD-2022-0607

$
0
0

Back in June, along with the release of Splunk 9.0, Splunk dropped several security advisories. I’m spending a little time digging in on SVD-2022-0607. Come along with me as we learn together.

The first thing of interest to me about this one is … we’ve been here before. Go back to https://www.duanewaddle.com/splunk-pass4symmkey-for-deployment-client-deployment-server/ and read the update from Martin:

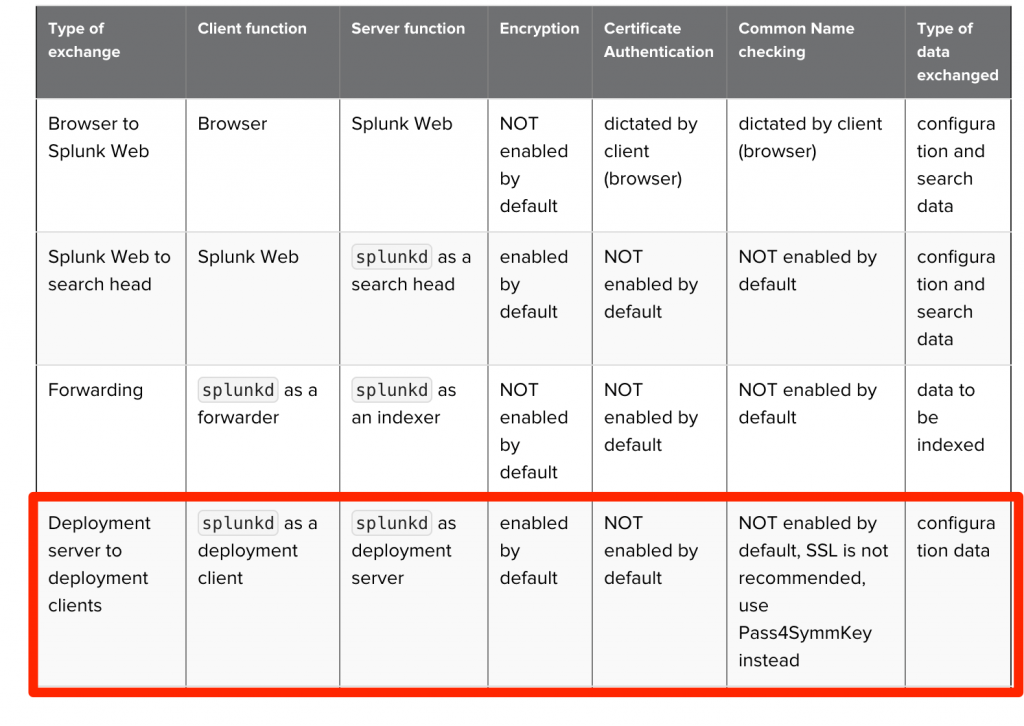
Discussing this feature with Martin Müller, there are some limitations here.  The [broker:broker] authentication for pass4SymmKey only protects the DS “control channel” API endpoint.  There are other API endpoints, like the app download endpoint, that will not require pass4SymmKey.  What this means is that an attacker who knows the names of your serverclasses and apps will still be able to download those apps from your DS without authentication.  See Splunk Ideas https://ideas.splunk.com/ideas/EID-I-391 which discusses this.

The good news I guess is that this is fixed? Now we’ll need to review the docs suggested by the SVD in terms of how to implement the fixes. Also go back and read my old blog post as a refresher – there’s some useful stuff in there. At first glance, I don’t think the docs are accurate / sufficient – I’ll have to do some docs feedback on that.

The Setup

In my test environment I have a DS and 2 UFs. The DS (ds) is running Splunk 9.0.2. One UF (uf9) running Splunk 9.0.2, the other (uf8) is running Splunk 8.2.9. To make understanding what is going on a little easier, I have disabled TLS on the DS REST API as follows in server.conf:

[sslConfig]
enableSplunkdSSL = false

Now I can use tcpdump to help understand the protocol between the UFs and DS, something tells me this will be important. On the DS I will enable the exact settings from the docs page in restmap.conf.


[broker:broker]
authKeyStanza=deployment
requireAuthentication = true

[streams:deployment]
authKeyStanza=deployment
requireAuthentication = true

On the UFs I won’t do anything special but set them up to use the DS in deploymentclient.conf, but in HTTP mode:

[target-broker:deploymentServer]
targetUri= http://ds:8089

The Test

Now we will set up a trivial app (testapp) and serverclasses.conf for it, and watch what happens on both uf8 and uf9. First from splunkd.log on uf9:

11-16-2022 03:38:43.840 +0000 INFO  HttpPubSubConnection [185 HttpClientPollingThread_29B28178-CD4D-4534-BE89-3D7C5D003BE5] - Running phone uri=/services/broker/phonehome/connection_10.89.0.6_8089_uf9.dns.podman_888d73cf5fde_29B28178-CD4D-4534-BE89-3D7C5D003BE5

11-16-2022 03:38:43.845 +0000 INFO  DeployedApplication [185 HttpClientPollingThread_29B28178-CD4D-4534-BE89-3D7C5D003BE5] - Checksum mismatch 0 <> 15970752176927723036 for app=testapp. Will reload from='http://ds:8089/services/streams/deployment?name=default:test:testapp'

11-16-2022 03:38:43.849 +0000 INFO  DeployedApplication [185 HttpClientPollingThread_29B28178-CD4D-4534-BE89-3D7C5D003BE5] - Downloaded url=ds:8089/services/streams/deployment?name=default:test:testapp to file='/opt/splunkforwarder/var/run/test/testapp-1668569894.bundle' sizeKB=10

11-16-2022 03:38:43.849 +0000 INFO  DeployedApplication [185 HttpClientPollingThread_29B28178-CD4D-4534-BE89-3D7C5D003BE5] - Installing app=testapp to='/opt/splunkforwarder/etc/apps/testapp'

11-16-2022 03:38:43.859 +0000 INFO  ApplicationManager [185 HttpClientPollingThread_29B28178-CD4D-4534-BE89-3D7C5D003BE5] - Detected app creation: testapp

11-16-2022 03:38:43.868 +0000 WARN  DC:DeploymentClient [185 HttpClientPollingThread_29B28178-CD4D-4534-BE89-3D7C5D003BE5] - Restarting Splunkd...

Now in the splunkd_access.log on the ds:

10.89.0.6 - splunk-system-user [16/Nov/2022:03:37:43.837 +0000] "POST /services/broker/phonehome/connection_10.89.0.6_8089_uf9.dns.podman_888d73cf5fde_29B28178-CD4D-4534-BE89-3D7C5D003BE5 HTTP/1.1" 200 407 "-" "Splunk/9.0.2 (Linux 5.15.0-52-generic; arch=x86_64)" - - - 1ms

10.89.0.6 - splunk-system-user [16/Nov/2022:03:38:43.842 +0000] "POST /services/broker/phonehome/connection_10.89.0.6_8089_uf9.dns.podman_888d73cf5fde_29B28178-CD4D-4534-BE89-3D7C5D003BE5 HTTP/1.1" 200 471 "-" "Splunk/9.0.2 (Linux 5.15.0-52-generic; arch=x86_64)" - - - 2ms

10.89.0.6 - splunk-system-user [16/Nov/2022:03:38:43.848 +0000] "POST /services/streams/deployment?name=default:test:testapp HTTP/1.1" 200 265 "-" "Splunk/9.0.2 (Linux 5.15.0-52-generic; arch=x86_64)" - - - 1ms

This is pretty reasonable. We see the “phone home” event on both the UF and the DS, and the “download” from the DS and the install to the UF. The app is out there and all is well. But on uf8 running Splunk 8.2.9, things are not looking so great:

11-16-2022 03:51:17.044 +0000 INFO  HttpPubSubConnection [139 HttpClientPollingThread_EDC9AFAC-E27B-4D71-B824-9C4D1CDD2AD0] - Running phone uri=/services/broker/phonehome/connection_10.89.0.5_8089_uf8.dns.podman_6f42c58a52ce_EDC9AFAC-E27B-4D71-B824-9C4D1CDD2AD0

11-16-2022 03:51:17.049 +0000 INFO  DeployedApplication [139 HttpClientPollingThread_EDC9AFAC-E27B-4D71-B824-9C4D1CDD2AD0] - Checksum mismatch 0 <> 15970752176927723036 for app=testapp. Will reload from='http://ds:8089/services/streams/deployment?name=default:test:testapp'

11-16-2022 03:51:17.051 +0000 WARN  HTTPClient [139 HttpClientPollingThread_EDC9AFAC-E27B-4D71-B824-9C4D1CDD2AD0] - Download of file /opt/splunkforwarder/var/run/test/85d323c966bd0bee failed with status 401

11-16-2022 03:51:17.051 +0000 WARN  DeployedApplication [139 HttpClientPollingThread_EDC9AFAC-E27B-4D71-B824-9C4D1CDD2AD0] - Problem downloading from uri=ds:8089 to path='/services/streams/deployment?name=default:test:testapp'

11-16-2022 03:51:17.051 +0000 ERROR DeployedServerclass [139 HttpClientPollingThread_EDC9AFAC-E27B-4D71-B824-9C4D1CDD2AD0] - name=test Failed to download app=testapp

Oof. HTTP 401 errors coming back from attempts to download the app. But, this makes sense! We enabled authentication on the DS side for streams:deployment above, and Splunk has already told us that Splunk < 9.0.0 as a deployment client does not send pass4SymmKey authenticated requests for that endpoint. So this is not really a surprise – we are just setting the stage. Let’s see what’s in the pcap! From uf8 (Splunk 8):

POST /services/streams/deployment?name=default:test:testapp HTTP/1.1
User-Agent: Splunk/8.2.9 (Linux 5.15.0-52-generic; arch=x86_64)
TE: trailers, chunked
Host: ds:8089
Accept-Encoding: gzip
Content-Length: 0

From uf9 (Splunk 9):

POST /services/streams/deployment?name=default:test:testapp HTTP/1.1
User-Agent: Splunk/9.0.2 (Linux 5.15.0-52-generic; arch=x86_64)
TE: trailers, chunked
Host: ds:8089
Accept-Encoding: gzip
Content-Length: 0
x-splunk-lm-nonce: 1f6cc1fd7ef379df64d6709823d383d9
x-splunk-lm-timestamp: 1668569923
x-splunk-lm-signature: LIKvYvPhmg9vkgSh/qMyuX0XxrhEeT3Sc5cr/o3Fqvlqp6oDUFaesPwiOXM=
x-splunk-digest: v2,VgAXgTboCvGPJh8qIdg+MhDy18W1UkAMPPb3Uh75JWwIiu0j/zkub8adNs7t/E8JZdzozwHGGwRdOoCRgMWl0Q==

There’s some new request headers here. The pass4SymmKey is not DIRECTLY in the HTTP headers, but there’s definitely some new stuff here. With enough time, we might be able to figure out exactly what these headers are trying to say or how to validate them. But, the key thing here is that the key code change in Splunk 9.0.0 for SVD-2022-0607 was to add the pass4SymmKey authentication headers to this API call. Once that was done and your environment has rolled out Splunk >= 9.0.0 to every DS client, then the Splunk Administrator can enable the DS to require the headers via restmap.conf. To keep this story going, I’m going to upgrade uf8 to Splunk 9.0.2.

Mysterious Missing pass4SymmKey

If we look back at our DS, we had configured restmap.conf to look for pass4SymmKey in the deployment stanza of server.conf. The btool command will confirm this, but it will also confirm that no pass4SymmKey is set there.

[root@33e28c67e142 local]# /opt/splunk/bin/splunk btool --debug restmap list broker:broker | egrep authKeyStanza
/opt/splunk/etc/system/local/restmap.conf   authKeyStanza = deployment

[root@33e28c67e142 local]# /opt/splunk/bin/splunk btool --debug server list deployment
/opt/splunk/etc/system/local/server.conf [deployment]

So what pass4SymmKey is it using? Thankfully the README/restmap.conf.spec gives us a hint for the DS-side of the connection.

If no pass4SymmKey is available, authentication is done using the pass4SymmKey in the [general] stanza.

We could test this, but I’m going to take it at faith and do what seems to be the “right thing.” I’ll add a pass4SymmKey under the [deployment] stanza in server.conf.

[deployment]
# myfirstpass4symmkey
pass4SymmKey = $7$TZxP0ci6l/e88I7IcRGJuhJR/N1eLgNuUlv3wQqbi29ueVps/9D8SSuSLOMTka8ZAkks

After we do this and restart, both of our UFs are now failing to connect because they don’t have the right pass4SymmKey. There are HTTP 401 responses to their attempts to connect in the splunkd_access.log. I can add that pass4SymmKey to each of them using a [deployment] stanza. Once I do that they’re both able to connect.

Thinking about this some, this means that if I do nothing more than follow the procedure in the Splunk Docs above, my environment may be configured in a way that all of the UFs are authenticated to the DS using the default pass4SymmKey of “changeme“. The docs do suggest that setting a pass4SymmKey is a necessary prerequisite to this, but it turns out a default one for the [general] stanza is already set. A Splunk Admin has to be careful when implementing this in order to not present a thin veneer of “security”.

Also, this complicates UF deployment a bit. If I do configure a robust, non-default pass4SymmKey on the DS then my UFs need to know it before they can ever connect to the DS. Because the DS is usually how UFs are configured, this is a circular dependency. This means that my UFs need to be pre-seeded with the correct pass4SymmKey. This is extra work for the admin as part of deployment. For example, on Windows, the MSI does not include “deployment pass4SymmKey” as one of the supported arguments for the MSI. For Linux, the additional effort is probably not too large because Linux usually requires extra effort to configure the UF to phone home to a DS anyway. But, this definitely adds a new complexity to be handled as part of the UF deployment.

Changing the pass4SymmKey

So by now, we’ve ideally solved the deployment problems. We’ve installed Splunk 9.0.x UFs everwhere, we’ve pre-seeded them with a robust pass4SymmKey using the [deployment] stanza, and we’ve enabled authenticated access to our DS using restmap.conf. Of course, now that we’re done someone accidentally does a git commit with our pass4SymmKey in it and pushes it to a public GitHub repo. We’ll need to rotate the pass4SymmKey. This is a problem. If we first change the pass4SymmKey at the DS, that will cut all of the UFs off until we visit each one to give it the new value. If we start visiting UFs first, then we’ll cut them off one at a time until all have been visited. Neither of these are great.

We could turn off authentication until all of the UFs have been updated, and then re-enable it. That might work, but if we went to the effort of enabling authentication then this might not make sense. We added authentication for a reason, and just arbitrarily turning it off just to rotate a password seems less than ideal. Surely we didn’t enable authentication just to put a check mark in a compliance mandated security theater spreadsheet?

It turns out that Splunk anticipated this in restmap.conf, but you only see the hint of it from the spec file. In the authKeyStanza key, you can list multiple server.conf stanzas that contain pass4SymmKey values. So we can do this on the DS:

[root@33e28c67e142 local]# cat restmap.conf 

[broker:broker]
authKeyStanza=deployment, deployment2
requireAuthentication = true

[streams:deployment]
authKeyStanza=deployment, deployment2
requireAuthentication = true


[root@33e28c67e142 local]# /opt/splunk/bin/splunk btool server list deployment
[deployment]
pass4SymmKey = $7$TZxP0ci6l/e88I7IcRGJuhJR/N1eLgNuUlv3wQqbi29ueVps/9D8SSuSLOMTka8ZAkks
[deployment2]
pass4SymmKey = $7$+N40XRehCqEaLsWuaVQntroku8ekkskZ7IqG2xSkTt6Ejkal5/rdb5bsBswF0IIgXyPGyHgdKHv2cShtTkwb2X8xZg==

[root@33e28c67e142 local]# /opt/splunk/bin/splunk cmd splunkd show-decrypted --value '$7$TZxP0ci6l/e88I7IcRGJuhJR/N1eLgNuUlv3wQqbi29ueVps/9D8SSuSLOMTka8ZAkks'
myfirstpass4symmkey

[root@33e28c67e142 local]# /opt/splunk/bin/splunk cmd splunkd show-decrypted --value '$7$+N40XRehCqEaLsWuaVQntroku8ekkskZ7IqG2xSkTt6Ejkal5/rdb5bsBswF0IIgXyPGyHgdKHv2cShtTkwb2X8xZg=='
mysecondkeybecausethefirstwasleaked

Now, the DS supports either one of these pass4SymmKey values. We can put either of them on a UF and do a transition from one to the other. Check out uf8 and uf9 using different pass4SymmKeys:

[root@888d73cf5fde local]# /opt/splunkforwarder/bin/splunk btool server list deployment
[deployment]
pass4SymmKey = $7$FhVu9cYZfT0eAZX42cOYtfNJDIV5WIDUsi1dtczbFKhbQud5EiksI/+rMNO+o0pjfPIbQU76XkNgQI2tFAckG1tm4w==

[root@888d73cf5fde local]# /opt/splunkforwarder/bin/splunk cmd splunk show-decrypted --value '$7$FhVu9cYZfT0eAZX42cOYtfNJDIV5WIDUsi1dtczbFKhbQud5EiksI/+rMNO+o0pjfPIbQU76XkNgQI2tFAckG1tm4w=='
mysecondkeybecausethefirstwasleaked


[root@6f42c58a52ce testapp]# /opt/splunkforwarder/bin/splunk btool server list deployment
[deployment]
pass4SymmKey = $7$RLJg9Y2qsPjYkHZmXdiZ9GYHXBDPU2xfutAy97GTozXsCOvYpOtIz+Nr7JekYu4iTQSw

[root@6f42c58a52ce testapp]# /opt/splunkforwarder/bin/splunk cmd splunkd show-decrypted --value '$7$RLJg9Y2qsPjYkHZmXdiZ9GYHXBDPU2xfutAy97GTozXsCOvYpOtIz+Nr7JekYu4iTQSw'
myfirstpass4symmkey

And if we look on the DS, both are getting HTTP 200 responses in splunkd_access.log for their DS phonehomes:


10.89.0.5 - splunk-system-user [17/Nov/2022:03:08:56.344 +0000] "POST /services/broker/phonehome/connection_10.89.0.5_8089_uf8.dns.podman_6f42c58a52ce_EDC9AFAC-E27B-4D71-B824-9C4D1CDD2AD0 HTTP/1.1" 200 24 "-" "Splunk/9.0.2 (Linux 5.15.0-52-generic; arch=x86_64)" - - - 1ms


10.89.0.6 - splunk-system-user [17/Nov/2022:03:09:24.132 +0000] "POST /services/broker/phonehome/connection_10.89.0.6_8089_uf9.dns.podman_888d73cf5fde_29B28178-CD4D-4534-BE89-3D7C5D003BE5 HTTP/1.1" 200 471 "-" "Splunk/9.0.2 (Linux 5.15.0-52-generic; arch=x86_64)" - - - 1ms

Wrap up

So we did a bit of a deep dive into how UFs (and other deployment clients) talk to DSes. We enabled DS authentication of the UFs and saw how code changes in Splunk 9.0.0 made it possible to enable pass4SymmKey authentication for app downloads from the DS. We even learned how to do pass4SymmKey secret rotation without shooting ourselves in the foot.

One important thing to (again) note. This is not mutual authentication. Having the DS authenticate clients using pass4SymmKey does not guarantee that clients are talking to a legitimate DS. Without correct TLS certificates and configurations, an attacker can still stand up a fake DS that does not require client pass4SymmKey authentication. In this scenario, clients will download and execute arbitrary apps from the attacker DS. Always perform a realistic assessment of your threat model and take the right steps to reduce risk in your environment.

Viewing all 16 articles
Browse latest View live